Exploring income and education gaps
07 Nov 2018
It’s not new news that income can predict success in school (see here, here, and here), but I set out to determine the size of the gap in Washington schools, how it trends across grades, and whether schools with diversity (both rich and poor kids) have success. I don’t propose any solutions here; I’m simply analyzing data to understand the divide.
This post looks at Washington State data that is provided by the Office of Superintendent of Public Instruction (OSPI) for their Smarter Balanced Assesments that occur from grade 3 onwards. From this data source, I attempted to answer the following questions:
-
What is the size of the achievement gap, as measured by assessment scores?
-
Does the gap widen or shrink as kids grow in grade?
-
Is there a halo effect for low income kids when the attend high performance schools?
What is the size of the achievement gap?
One of the largest predictors of meeting standards at your grade is income. It’s not the only factor, but for this article, I want to focus on it. In Washington, they report assessment scores starting in the 3rd grade. In 2018, the statewide gap for all grades was large. The percentage of low income kids meeting grade level standards was 32 percentage points lower (44% vs 76%) in english language learning and 33 percentage points lower in math (33% vs 66%).
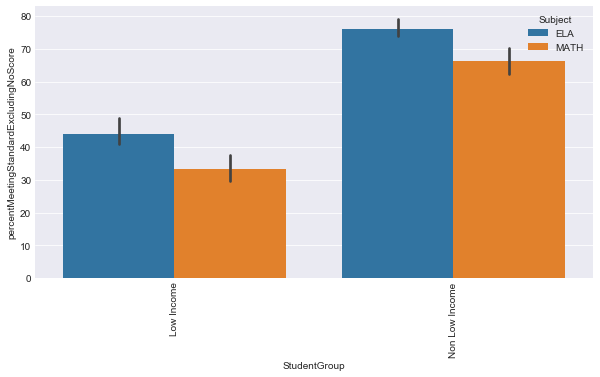
Put these numbers in perspective. If you aren’t low income, you are twice as likely to be meeting standards in math, and 1.7 times as likely to meeting standards in language learning. The achievement gap across all grades is large. But, as always, we should be concerned about trends as kids progress. That is: do we see growth as kids progress through school?
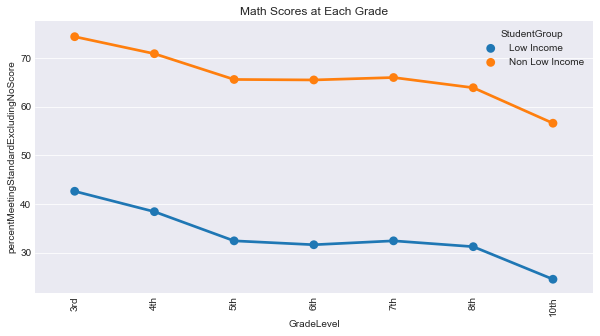
Does the gap widen or shrink as kids grow in grade?
This is not apples-to-apples comparison, since we’re not looking at individual students. But, when you plot the gap between these student groups for different grades, it gets interesting – they both trend downwards for math across grades. Essentially, the gap remains as kids fall further behind.
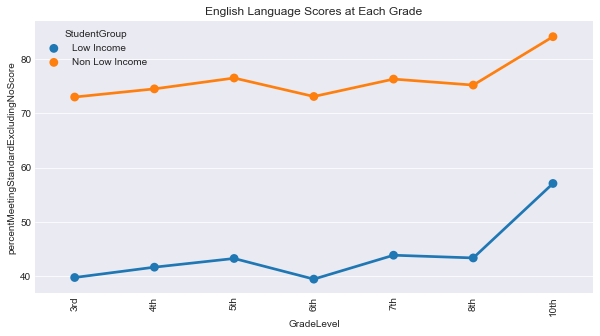
But, for language learning, the gaps widen and then suddenly narrow in 10th grade. It’s such an alarming number, that I’ve put in a request to OSPI to help diagnose the underlying causes (does the test change or is it the same test just taken later? Is there an intervention program in 10th grade?). Regardless of the answer to that question, we still see a gap.
Is there a halo effect for low income kids when they attend high performance schools?
Yes, the data suggests that good schools can do well for both groups (low income and non-low income), but the gap widens as the performance exceeds average. We can plot performance of the same school in test performance across income groups (if they have enough students in the group – suppression occurs if there are less than 10 kids in a low-income group at the given school). This is performance for 3rd grade schools in Math across the state of Washington:
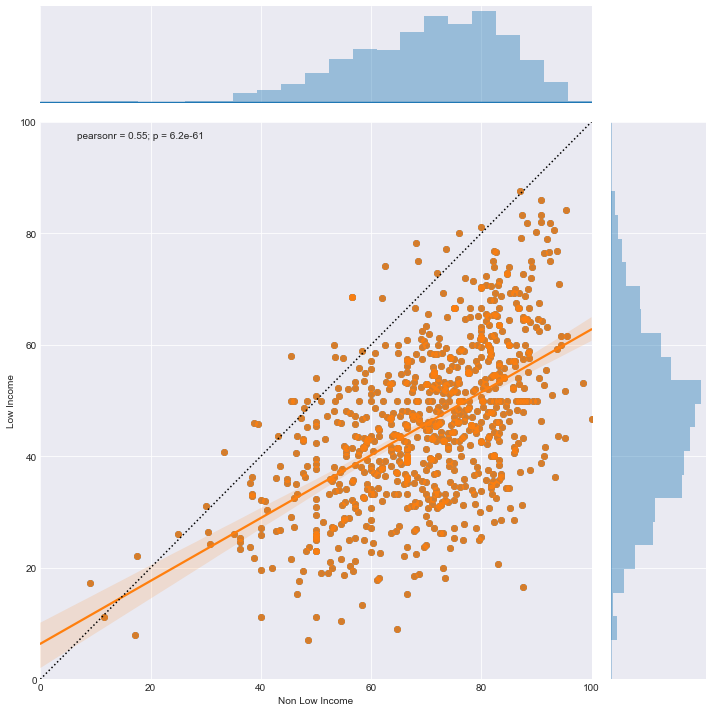
And, also in language:
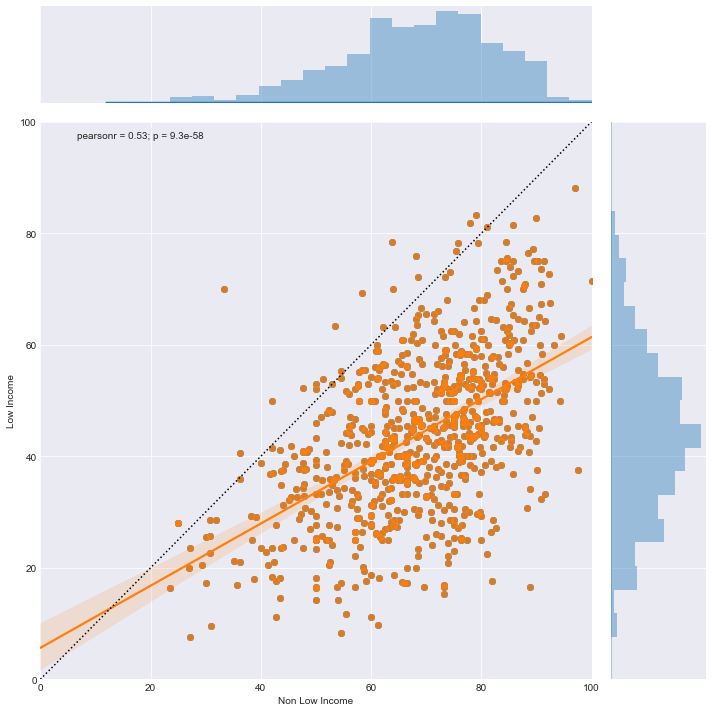
As you can see from the above charts’ trend lines, there is positive correlation (scores move together) between the income groups. If a school is above average for non-low income students, it’s likely above average for low income students. However, the gap appears to actually widen as we move towards the more high-performing schools.
Next steps
This is just saying what we probably already know – lower income kids are not doing as well in tests. The underlying cause still needs to be explored, but not all of those are easy with data. As I search for more datasets (assuming some might require access to secret data sources from the OSPI), I hope to explore:
-
What is the effect of pre-school (“Pre-K Readiness”) on closing the gap? The gap is wide as early as 3rd grade, and it sustains. Presumably, if we closed the gap before 3rd grade, it’d stick?
-
What is effect of being below standard early in an academic career on drop-out rates? Do we see personal correlation with failure in, say, 5th grade that predicts dropouts?
-
How does compound factors affect all of the above (e.g. race plus low income, homeless plus race)? When taken together, there is likely some predictive analysis that can help us determine where an individualized educational program, social work, or tutoring is required.
-
Can we isolate individual schools we think are doing well and see those trends in the data?
I’d love to encourage a discussion on this. I don’t have comments on this site, but will soon post on Hacker News to continue the conversation and get your input on what types of data to explore next.
This post was part of Udacity’s Data Science coursework and is currently under review.
Image used under Creative Commons license w/ 0 modification - photo by Pommiebastards@Flickr